I design and build web applications.
I use JavaScript, Python, WordPress, HTML, CSS, jQuery, D3 and more.
Available for hire.
Some things I've made recently...

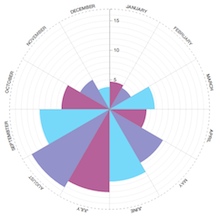
Radial bar chart reusable D3 component
Radial bar chart reusable D3 component

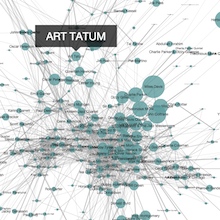
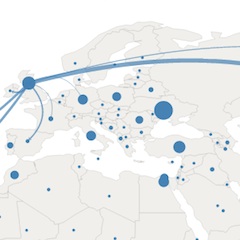
Crisis visualisation
Crisis visualisation

Understanding D3 Selections
Understanding D3 selections
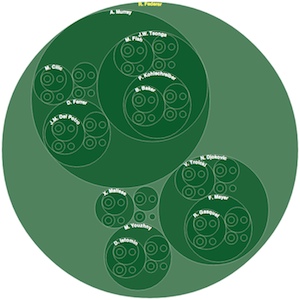
Wimbledon Visualisations
10 different visualisations of Wimbledon 2012.

Wimbledon Visualisations
10 different visualisations of Wimbledon 2012.

Binary tree
A binary tree with a degree of geometric randomness. The user can regenerate the tree and hovering over a branch highlights the path back to the root.
Built with D3.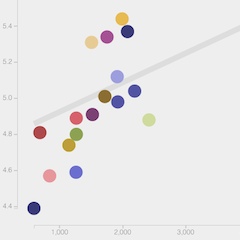
What Makes Us Happy?
An interactive scatterplot of well-being in 22 European countries plotted against measures such as GDP, equality and working hours.
Made with D3.
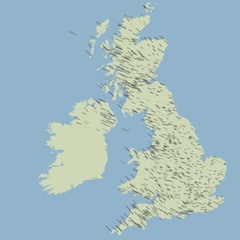
UK Animated Wind Chart
A visualisation of wind in the UK using animation to depict the strength and direction of the wind.
Made with D3.


I've worked with...


I like to use...
JavaScript, jQuery, D3, HTML5, CSS3, Python, WordPress and others
Tutorials and talks
Slides from my How to Build a WordPress Plugin talk given at WordUp Brighton
Slides from my Beyond the Bar Chart talk given at Nerd Nite Brighton
An interactive explanation of D3 selections
Building Data Visualisations with D3 One Day Workshop
Slides from my talk at the London D3 Meetup (June 2013) '10 Views of a Single Dataset'
Slides from my Async talk 'D3.js - Data Visualisation in the Browser'
Projects
Circular heat chart component for D3.js
ChartMe WordPress plugin for Google Chart Tools
Blog
Creative data visualisation: a structured approach
Building Data Visualisations with D3 One Day Workshop
Making the UK animated wind chart
What goes into a data visualisation?
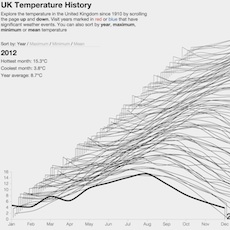
Data visualisation of UK temperature
Data visualisation of UK rainfall
Circular heat chart component for D3.js
Energy data visualisation using D3.js
Visualising event attendance using D3.js